
[Archive] All quiet ....
There is so much to talk about, but alas I have a looming deadline. So instead, I'll just post an interesting graph of three different activities
(in this case products).
The axes are:-
- Ubiquity : or how common an activity is, calculated from market penetration statistics and household / business surveys.
- Certainty : or how well an activity is understood, calculated from a ranking system that includes a relative total number of technical references cited in the British Library.
Ubiquity vs Certainty for TVs, Telephones and VCRs.
(click on image for larger size)
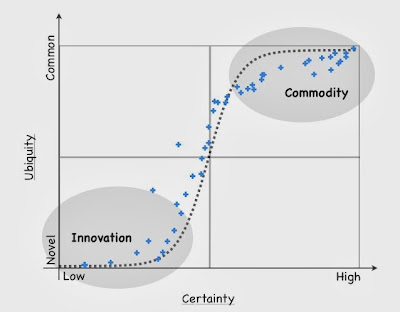
Now, I haven't highlighted which data set belongs to which product because it doesn't matter. They are all following the same approximation despite occurring over vastly different time ranges.
Is this an Everett's S-Curve? Not quite, I don't use time as an axis but certainty (so it does have a non-simple relationship with time).
Originally published on blog.gardeviance.org.